
AR and VR in Retail: What It Is and How to Evaluate It
Retail XR splits into hardware in a store and software on a shopper's device, and the two are different businesses. In-store installations have to be manufactured, shipped, installed, powered, updated and repaired across every location, and the recurring cost of keeping them working usually exceeds the cost of building them. Online experiences scale with the catalog instead.
In short:
- What it is: Augmented and virtual reality used to sell, covering in-store installations, virtual showrooms, product visualization on a product page, try-on and configuration.
- What it is not: A demo problem. Everyone demonstrates a product appearing convincingly in a room. Programs fail on the catalog, not on the demo.
- What decides the shortlist: Physical or digital retail, published retail evidence, what the supplier delivers and supports afterwards, and what the retailer owns.
- What kills programs: Cost per 3D asset at volume. A pilot covering twelve hero products proves nothing about a catalog of two thousand.
What retail XR covers
Retail XR is the use of augmented and virtual reality to help someone choose or buy something. It spans a shop floor installation, a virtual showroom, a product visualized in a customer's own room, a garment tried on and a product configured to order.
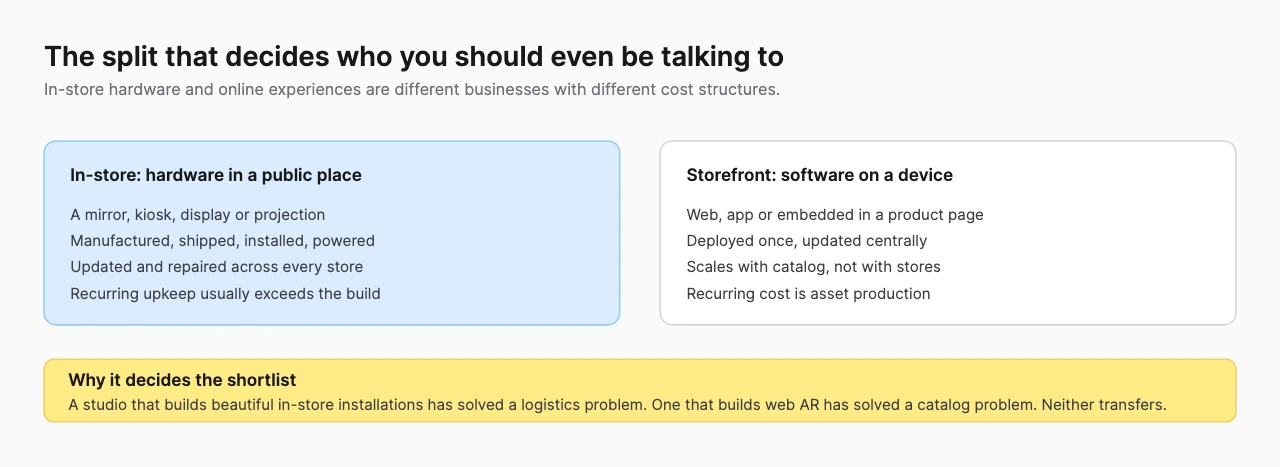
The split between store and storefront runs through the whole category and decides who you should even be talking to.
In-store AR and VR is hardware in a public place: a mirror, a kiosk, a display, a projection. It has to be manufactured, shipped, installed, powered, updated and repaired, across however many stores you have. The recurring cost of keeping it working usually exceeds the cost of building it, and that ratio is the single most under-modeled number in the category.
Storefront work is software. It deploys once, updates centrally and scales with the catalog rather than with the estate. Its recurring cost is asset production, which is a different problem with a different supplier behind it.
The distinction that decides everything else
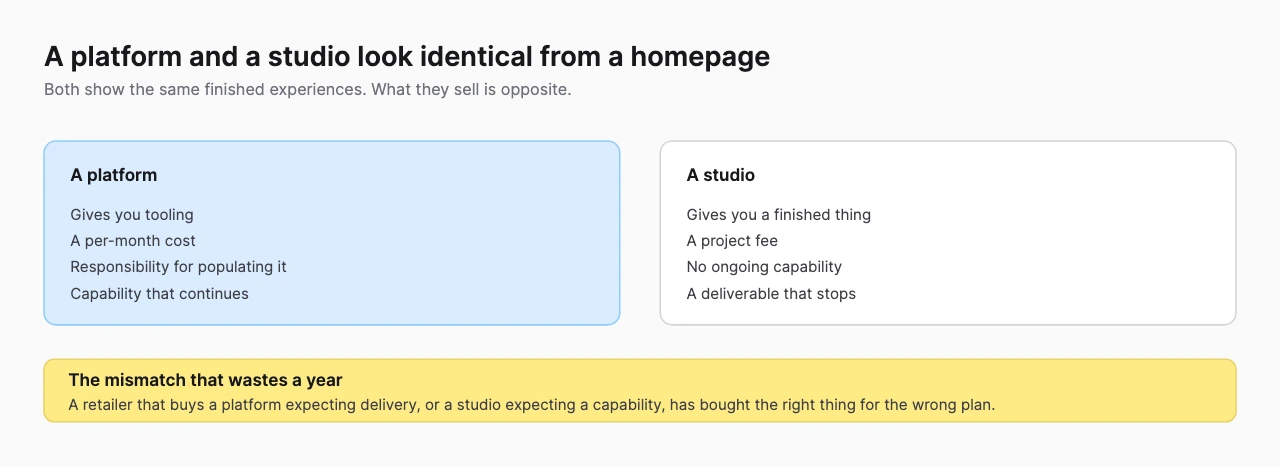
A platform and a studio are genuinely hard to tell apart from a homepage, because both show the same finished experiences.
A platform gives you tooling, a per-month cost and responsibility for populating it. A studio gives you a finished thing, a project fee and no ongoing capability. A retailer that buys a platform expecting delivery, or a studio expecting a capability, has bought the right thing for the wrong plan.
| Platform | Studio | |
|---|---|---|
| You receive | Tooling and a capability | A finished experience |
| Cost shape | Per month, ongoing | Project fee |
| Who populates it | You | Them |
| What continues | The capability | Nothing |
| Suits | A catalog that keeps changing | A campaign or a flagship |
Best AR development companies for ecommerce records this distinction first for every entry, because it decides the operating model rather than just the price.
The catalog problem
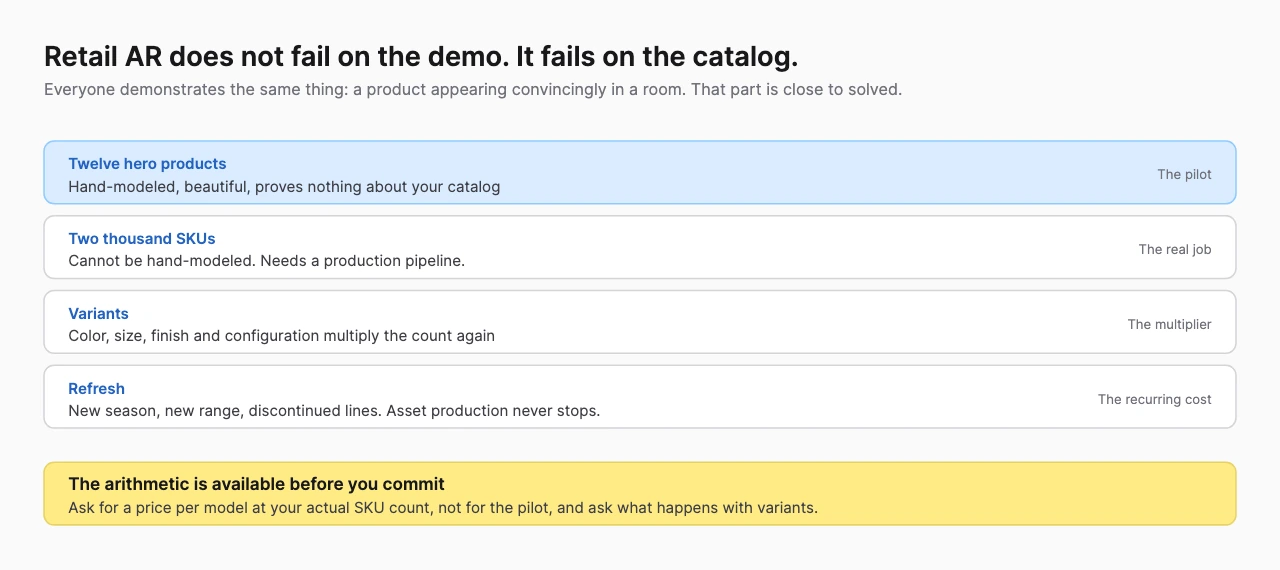
Everyone selling in this category demonstrates the same thing: a product appearing convincingly in a room through a phone. That part is close to solved and it is not where projects fail.
They fail on the catalog. A retailer with eight thousand SKUs, or a manufacturer with configurable products in thousands of variants, cannot hand-model its way to coverage. A pilot covering twelve hero products proves nothing about the program that follows it.
The arithmetic is available before you commit. Ask for a price per model at your actual SKU count rather than for the pilot, and ask what happens with variants. A program that works at twelve products and collapses at two thousand is the standard failure in this category.
Where the 3D actually comes from
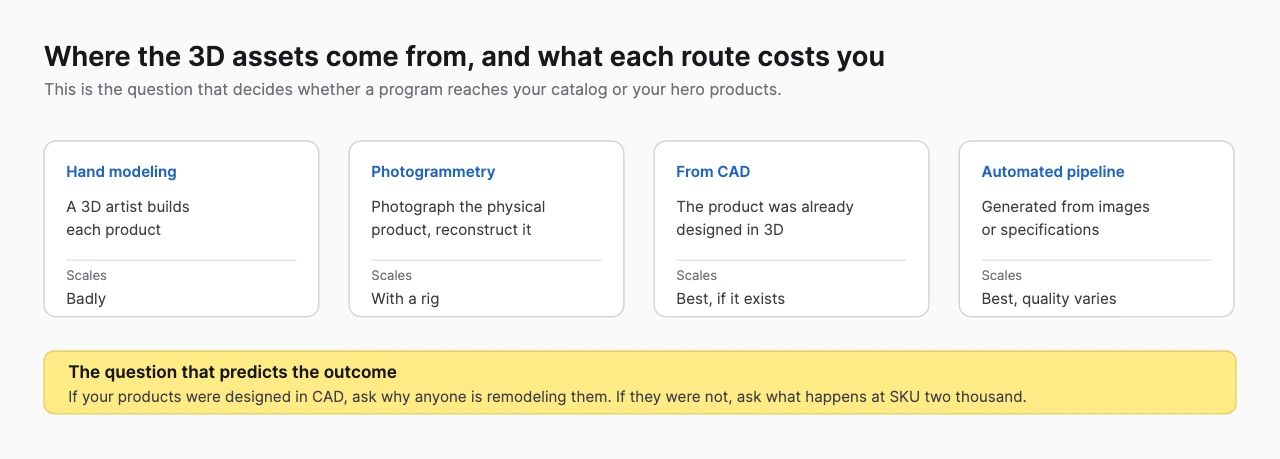
If your products were designed in CAD, ask why anyone is remodeling them. If they were not, ask what happens at SKU two thousand. Best AR companies for product visualization ranks on where the assets come from and whether production scales, which is the question the demonstration is designed not to raise.
The product visualization guide covers the asset pipeline in more detail, since the same problem appears wherever 3D is produced at catalog scale.
Retail XR by purchase
Five distinct purchases, each with its own ranked list.
Cross-segment retail
Best AR and VR development companies for retail ranks on whether a supplier serves physical or digital retail, published retail evidence, what they deliver and support afterwards, and what the retailer owns.
Virtual showrooms and stores
Best companies for VR virtual showrooms and stores covers browsable environments, bought by brand and marketing teams and judged on engagement rather than on conversion.
Ecommerce AR
Best AR development companies for ecommerce covers product-page AR, where the platform and studio distinction decides the operating model and where integration with the commerce system is the real work.
Furniture and home goods
Best AR companies for furniture and home goods placement covers the category where AR has the clearest commercial case, because the question the shopper is asking is literally whether it fits.
Product customization
Best AR companies for retail product customization covers configured and personalized goods, where the economics change in three directions at once.
What customization does to the business
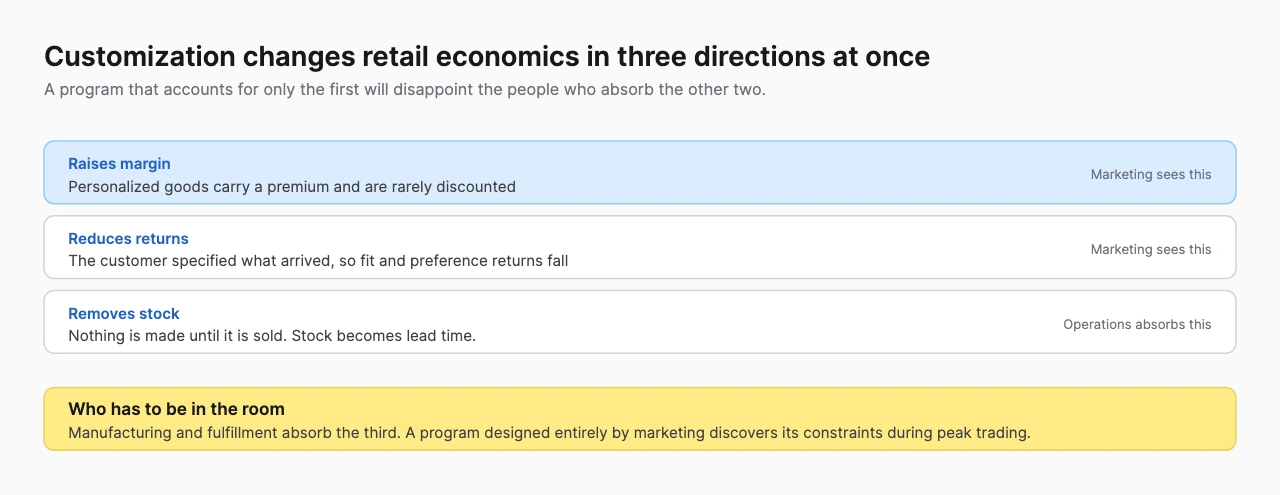
Customization raises margin, because personalized goods carry a premium and are rarely discounted. It reduces returns for fit and preference, because the customer specified what arrived. And it removes the ability to hold stock, since nothing is made until it is sold.
Marketing sees the first two. Manufacturing and fulfillment absorb the third, and they are the people who have to turn stock into lead time. A program designed entirely by marketing tends to discover its constraints during its first peak trading period, which is the worst possible moment.
Involving operations before launch is the single most useful thing a customization program can do, and it costs nothing.
What decides a configurator project
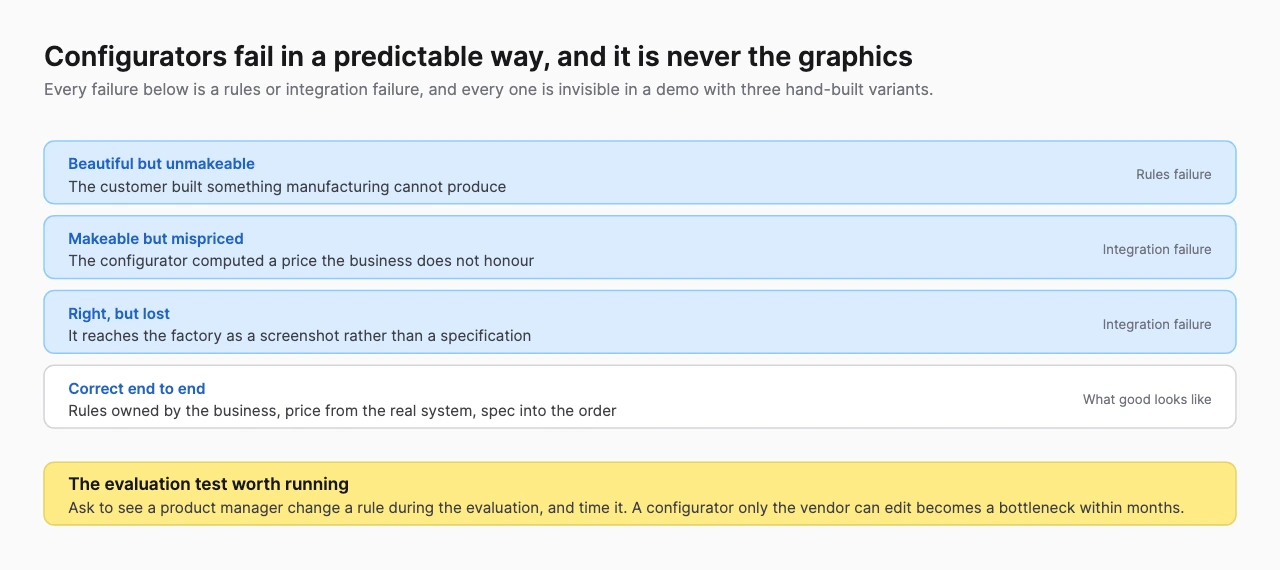
Configurator outcomes are predictable, and they are never decided by the graphics.
A customer builds something beautiful that cannot be manufactured. Or it can be manufactured but was priced wrong. Or it is priced right but reaches the factory as a screenshot rather than a specification. Every one of those is a rules and integration failure, and every one is invisible in a demonstration where the vendor has hand-built three variants.
Two tests worth running during evaluation. Ask to see a product manager change a rule, and time it: a configurator whose constraints only the vendor can edit becomes a bottleneck within months. And ask where the price comes from: a configurator that computes its own price will eventually disagree with the system that takes the money.
Best companies for custom 3D product configurators ranks on how configuration rules are modeled and what the configurator connects to downstream, which is where this category actually lives.
What sets a retail XR schedule
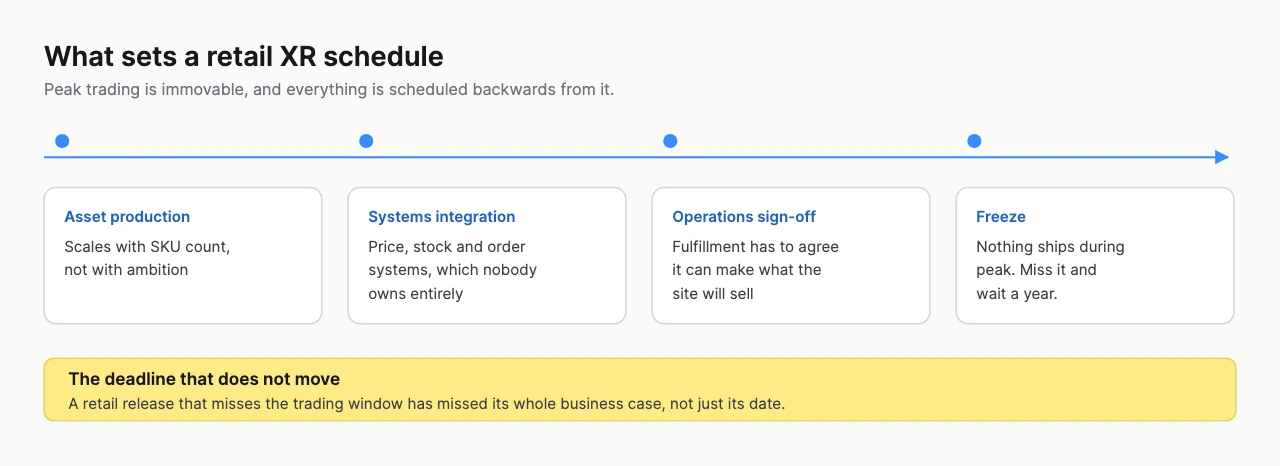
Peak trading is immovable, and everything schedules backwards from it.
Asset production scales with SKU count rather than with ambition. Systems integration touches price, stock and order systems that no single team owns. Operations sign-off means fulfillment agreeing it can make what the site will sell. And then there is a freeze: nothing ships during peak, so a release that misses the window has missed its business case rather than just its date.
| Cost center | Scales with | Usually quoted | Notes |
|---|---|---|---|
| 3D asset production | SKU count and variants | Per-asset, for the pilot | The number that decides the program |
| In-store hardware | Number of stores | Sometimes | Upkeep usually exceeds the build |
| Integration | Commerce, PIM, order systems | Partly | Depends on systems the supplier does not control |
| Platform license | Traffic or SKU tier | Yes | Published more often than studio fees |
| Asset refresh | Range changes per year | Rarely | Never stops while the catalog changes |
Who supplies retail XR
Four kinds of supplier, and the difference explains most of the spread between quotes.
Web AR platforms deliver to a browser without an app. Poplar Studio, Aircards and Zappar work here. Reach is the strongest argument, since nothing is installed, and the constraint is what a phone browser can render.
Commerce 3D platforms sit inside the retail stack, handling assets, configuration and delivery at catalog scale. 3D Cloud, Threekit and VNTANA work this way, and their value is the pipeline rather than any single experience.
High-value configuration specialists serve categories where one sale justifies significant rendering cost. ZeroLight works in automotive, where paint alone is a rendering problem.
In-store hardware companies manufacture and maintain physical installations. Outform works here, and this is a logistics and field-service business that happens to involve screens.
| Web AR platform | Commerce 3D platform | Configuration specialist | In-store hardware | |
|---|---|---|---|---|
| Sells | Reach without an app | A catalog pipeline | Fidelity and rules | Installed hardware |
| Cost driver | Traffic and campaigns | SKU count | Render quality and complexity | Store count |
| Recurring cost | License | Asset production | Rule maintenance | Field service |
| Fails when | The catalog grows | Nobody owns the assets | The order does not reach the factory | Nobody maintains the estate |
What happens after launch
Retail XR ages faster than anything else in this directory, because the catalog is the product and the catalog changes every season.
Assets go stale on a fixed cycle. A new range means new models, and a discontinued line means orphaned ones. Asset production is not a project that completes, it is an operating cost that continues while you sell things, and programs budgeted as a project run out of money at the second range change.
Rules drift from the business. A configurator encodes what can be made and what it costs. Both change constantly, and if the rules can only be edited by the vendor, the configurator gradually starts offering things the business will not honor. That is worse than having no configurator, because the customer has already been told yes.
Hardware in stores degrades in public. Screens get touched by thousands of strangers, headsets get dropped and kiosks get switched off by staff who need the socket. The estate needs a maintenance contract and someone who owns it, and the failure mode is that half the installations quietly stop working while head office still believes the program is live.
What you can check, and where
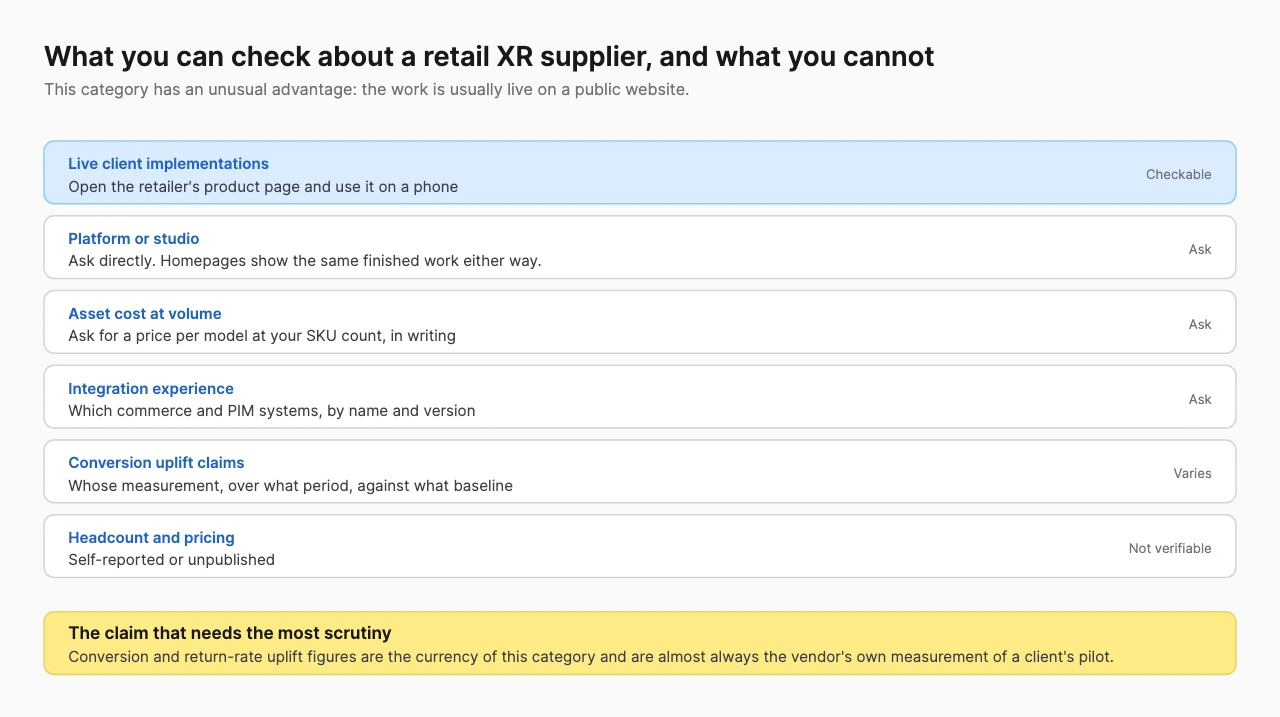
Retail has an unusual advantage: the work is usually live on a public website. A supplier's client implementations can be opened on a phone and used, which is a stronger check than a case study and takes a minute.
Conversion and return-rate uplift claims need the most scrutiny. They are the currency of this category and are almost always the vendor's own measurement of a client's pilot, over an unstated period, against an unstated baseline. Where a retailer has published the figure itself, it is citable. Where the vendor is reporting it, it is a claim, and our rankings treat it as such.
Cost per asset at volume is checkable and rarely volunteered. Ask for it in writing at your SKU count. A supplier confident in its pipeline will answer; one whose economics only work at pilot scale will describe the pilot again.
No primary source exists for market size or adoption projections in retail AR, and this site does not repeat them.
How the rankings below were built
Every list linked here ranks on four published criteria and states what is not a ranking factor, set out in each post under How this list was built.
Across the retail lists the recurring four are whether the supplier serves physical or digital retail, published retail evidence, what they deliver and support afterwards, and what the retailer owns. In the configurator and customization lists the criteria shift to how rules are modeled and what the configuration connects to downstream, because that is where those purchases succeed or fail.
The methodology page sets out how entries are assessed.
Where to start
Decide whether the problem is in your stores or on your storefront, then read the list covering it.
- Best AR and VR development companies for retail
- Best companies for VR virtual showrooms and stores
- Best AR development companies for ecommerce
- Best AR companies for furniture and home goods placement
- Best AR companies for retail product customization
The directory lists developers, platforms and software with sourced entries.
Related reading
Each of these covers one part of this subject in depth, with the suppliers ranked on criteria stated in the post.
- AR Companies for Virtual Try-On
- Companies for AR Product Visualization in Ecommerce
- Companies for 3D Furniture and Home Goods Configurators
- Companies for 3D Jewelry and Watch Configurators
Related reading. BestInXR's list of spatial computing companies explains why suppliers doing this work rarely use the term, and routes to the vertical list for each sector.
Frequently Asked Questions (FAQ)
1. What is AR used for in retail?
Helping someone choose or buy: visualizing a product in their own space, trying something on, configuring a made-to-order item, or browsing a virtual showroom. It also covers hardware installed in physical stores, which is a different business with a different cost structure.
2. Which companies build AR for retail?
They divide by model and by segment. Poplar Studio, Aircards and ByondXR work in ecommerce and web AR, 3D Cloud and Threekit in furniture and configuration, ZeroLight in high-value configuration, and Outform in physical in-store hardware.
3. What decides whether a retail AR program scales?
The catalog, not the demo. A pilot covering twelve hand-modeled hero products says nothing about a catalog of two thousand SKUs with variants. Ask for cost per asset at your real SKU count before committing.
4. What is the difference between an AR platform and an AR studio?
A platform gives you tooling, a monthly cost and the job of populating it. A studio gives you a finished experience, a project fee and no continuing capability. They look identical on a homepage because both show the same finished work.
5. What decides whether a product configurator works in production?
Rules and integration, never graphics. It works when the configurator enforces what can actually be made, prices from the same source as the ERP and delivers a specification to the factory rather than a screenshot. A demo with three hand-built variants exercises none of those three.
6. Can you verify AR conversion uplift claims?
Rarely. They are usually the vendor's own measurement of a client pilot, over an unstated period and against an unstated baseline. Where the retailer published the figure itself, it is checkable. Where the vendor reports it, it is a claim.
7. What does customization do to operations?
It removes stock and replaces it with lead time. Marketing sees the margin and the reduced returns; manufacturing and fulfillment absorb the change, which is why they need to be involved before launch rather than during peak trading.
8. How much does in-store AR hardware cost to run?
More than it costs to build, in most deployments. Hardware in a public place is handled by strangers all day and has to be powered, updated and repaired across every location, and that recurring cost is the number most often left out of a proposal.