3D and AR Product Visualization: What It Is and How to Evaluate It
Everyone in this category demonstrates the same thing: a product appearing convincingly in a room through a phone. That part is close to solved and it is not where programs fail. They fail on the catalog. A pilot covering twelve hero products proves nothing about a retailer with eight thousand SKUs.
In short:
- What it is: 3D and augmented reality used to show a product before it is bought, covering preview and placement, ecommerce visualization and configuration of made-to-order goods.
- What it is not: A rendering problem. The demo is solved. The cost per asset at volume decides whether the program reaches your catalog.
- What decides the shortlist: Where the 3D assets come from, whether asset production scales, where the visualization is delivered and what evidence each supplier publishes.
- What we could not verify: Conversion uplift figures for most suppliers. They are almost always the vendor's own measurement of a client pilot.
What product visualization covers
Product visualization is the use of 3D and augmented reality to show someone a product before they own it: placed in their room, spun on a product page or configured to a specification that does not exist yet.
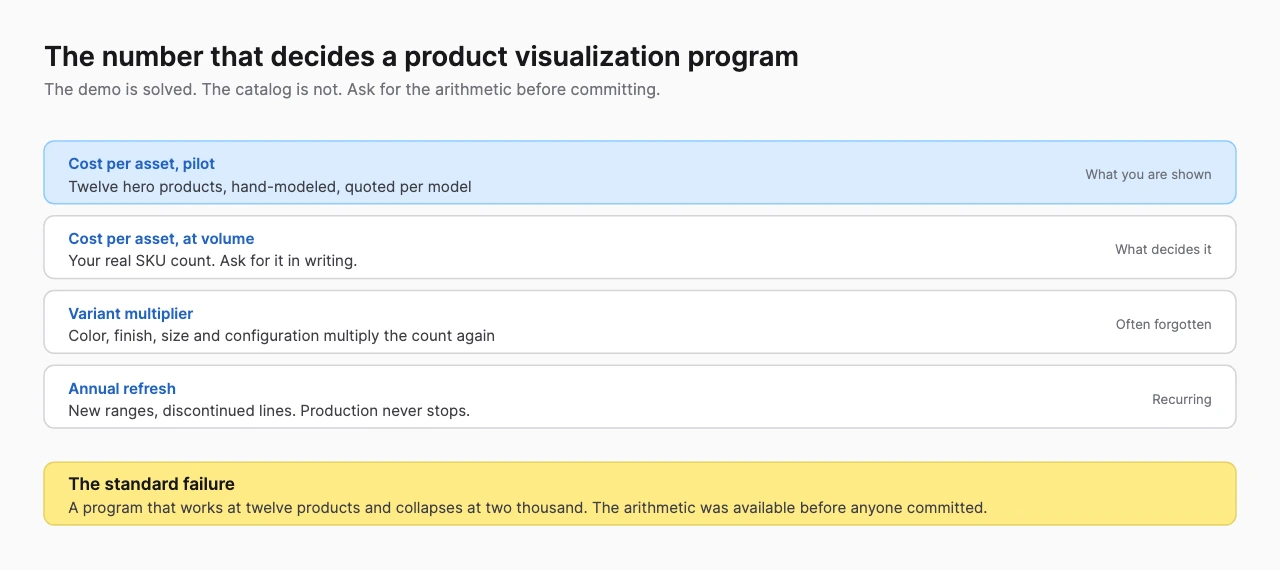
The category divides on a single number: cost per 3D asset at your actual catalog size. Every other question is downstream of it, and it is the question a demonstration is designed not to raise.
Ask for a price per model at your real SKU count rather than for the pilot, and ask what happens with variants. A program that works at twelve products and collapses at two thousand is the standard failure here, and the arithmetic is available before anyone commits.
Where the 3D actually comes from
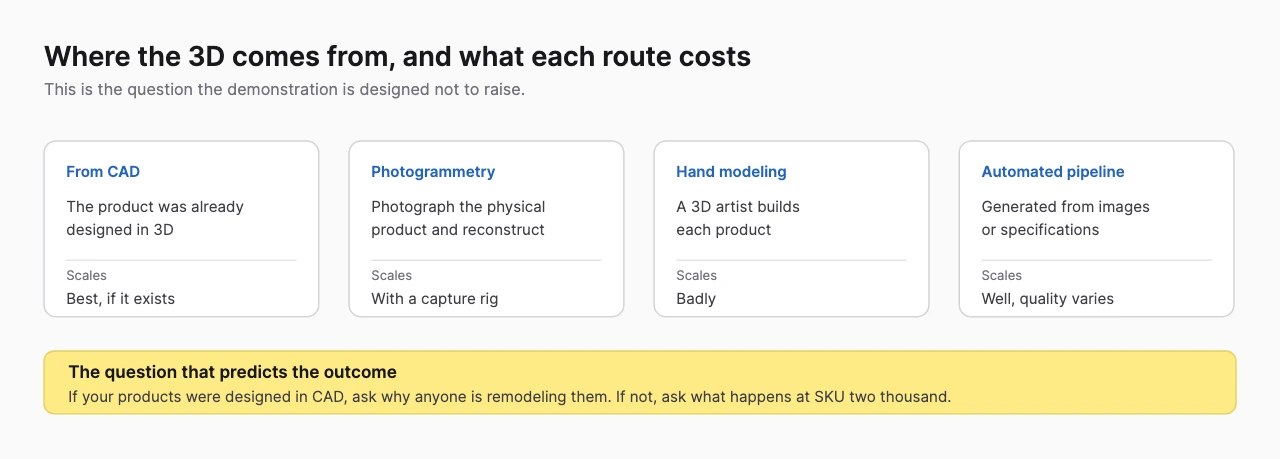
| Source | Scales | Best for | Watch for |
|---|---|---|---|
| From CAD | Best, where it exists | Manufactured goods designed in 3D | Engineering CAD needs conversion, not just import |
| Photogrammetry | With a capture rig | Physical goods with complex surfaces | Throughput depends on the rig, not the software |
| Hand modeling | Badly | Hero products, campaigns | Cost per asset stays flat as volume grows |
| Automated pipeline | Well | Large catalogs | Quality varies by product type |
If your products were designed in CAD, the first question is why anyone is remodeling them. Manufactured goods usually have 3D data already, and a supplier proposing to rebuild it from photographs is either unable to work with your source data or has not asked whether it exists.
If your products were not designed in 3D, the question becomes throughput. A capture rig that produces forty models a week and a catalog of eight thousand describe a program lasting four years.
Best AR companies for product visualization ranks on exactly this: where the assets come from, whether production scales, where the visualization is delivered and what evidence each supplier publishes.
Preview and configuration are different products
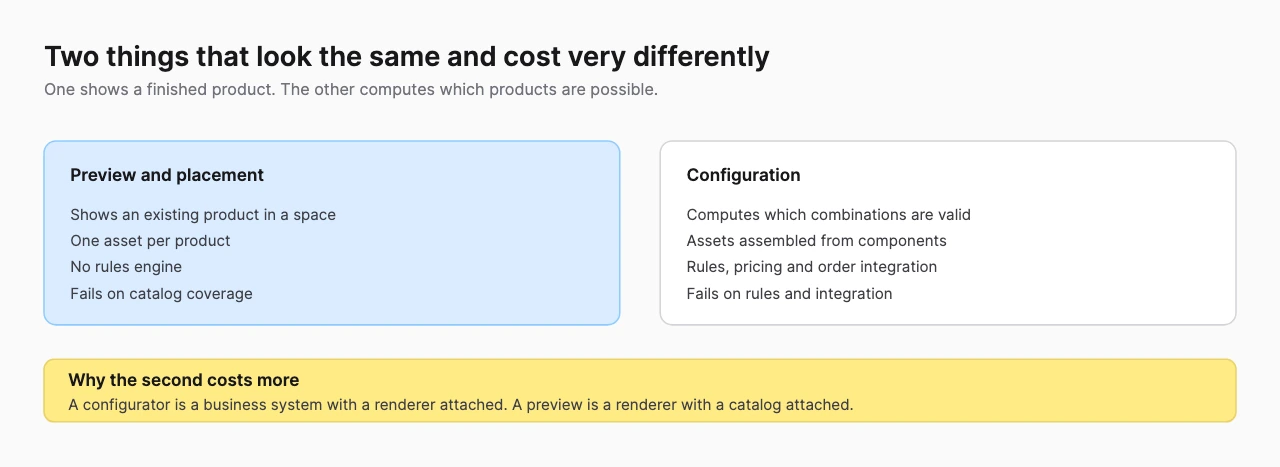
A preview shows an existing product in a space. One asset per product, no rules engine, and the failure mode is catalog coverage.
A configurator computes which combinations are valid. Assets are assembled from components, rules govern what can be built and prices and orders have to reach real systems. It fails on rules and integration, not on rendering.
The cost difference follows from that. A configurator is a business system with a renderer attached. A preview is a renderer with a catalog attached, and buying the second while describing the first is the most expensive misunderstanding in this category.
What a configurator has to get right
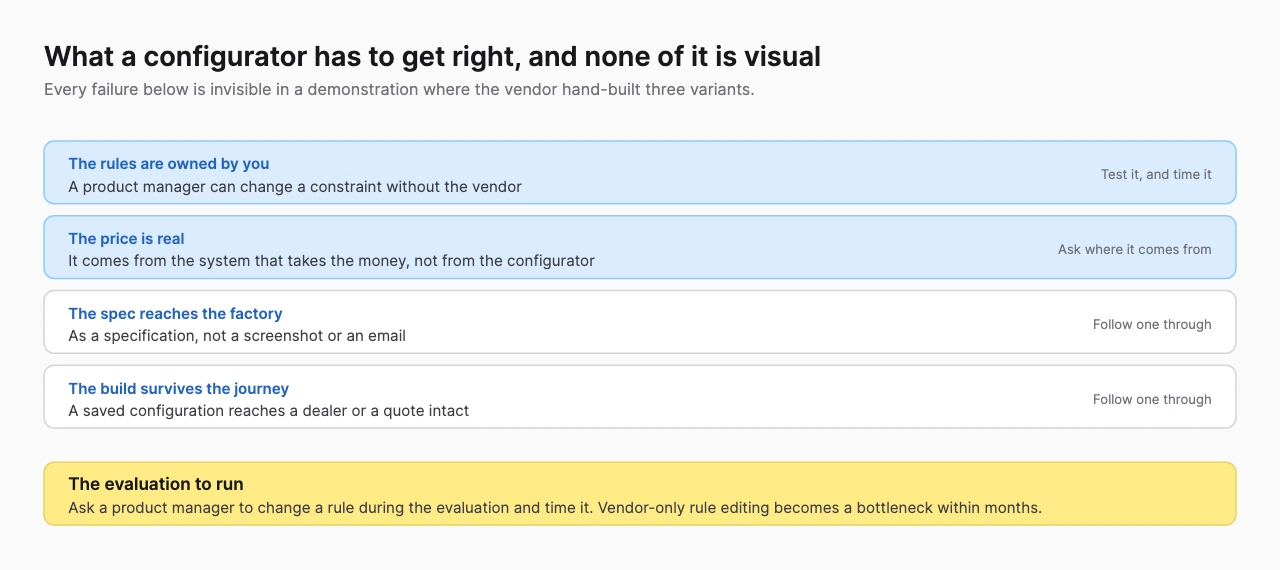
None of it is visual, and all of it is invisible in a demonstration where the vendor hand-built three variants.
The rules are owned by you. Products change constantly, and a configurator whose constraints can only be edited by the vendor becomes a bottleneck within months. Ask to see a product manager change a rule during the evaluation, and time it.
The price is real. A configurator that computes its own price will eventually disagree with the system that takes the money. Ask where the number comes from.
The specification reaches the factory. As a specification, not a screenshot and not an email. Follow one order through end to end during the evaluation.
The build survives the journey. A saved configuration has to reach a dealer, survive a finance quote and often become a factory order without the customer re-specifying anything.
Best companies for custom 3D product configurators ranks on how configuration rules are modeled, what the configurator connects to downstream, the rendering approach and what the buyer owns.
Why automotive is its own problem

Four things push in the same direction. Combinatorics run to millions of valid vehicles once trim, engine, paint, wheels, interior and packs multiply. Paint is a rendering problem of its own, because metallic and pearlescent finishes behave differently under different lighting. The buyer expects photographic fidelity. And the output has to become a real order.
Best companies for 3D car and automotive configurators ranks on rendering fidelity and how it is delivered, how configuration rules and pricing are handled, published automotive evidence and what the configuration produces.
Jewelry and watches are the other category whose rules are its own, for a different reason. There the material is the product, so carat and cut variation, the behavior of metal under light and finishes like guilloche decide whether a buyer believes the render at all. Best companies for 3D jewelry and watch configurators ranks on published luxury work, what the renderer does with gems and metal, what the configurator connects to and what the buyer owns.
Furniture is the third case, and there the hard part is neither combinatorics nor material. It is the handoff. A configured sectional is a bill of materials, a set of finishes and an assembly sequence, so best companies for 3D furniture and home goods configurators ranks on what the configurator produces downstream rather than on how it renders.
Establish the path from configuration to order before evaluating any visual. A beautiful configurator that ends in a lost specification has generated a frustration rather than a lead.
Where the visualization is delivered
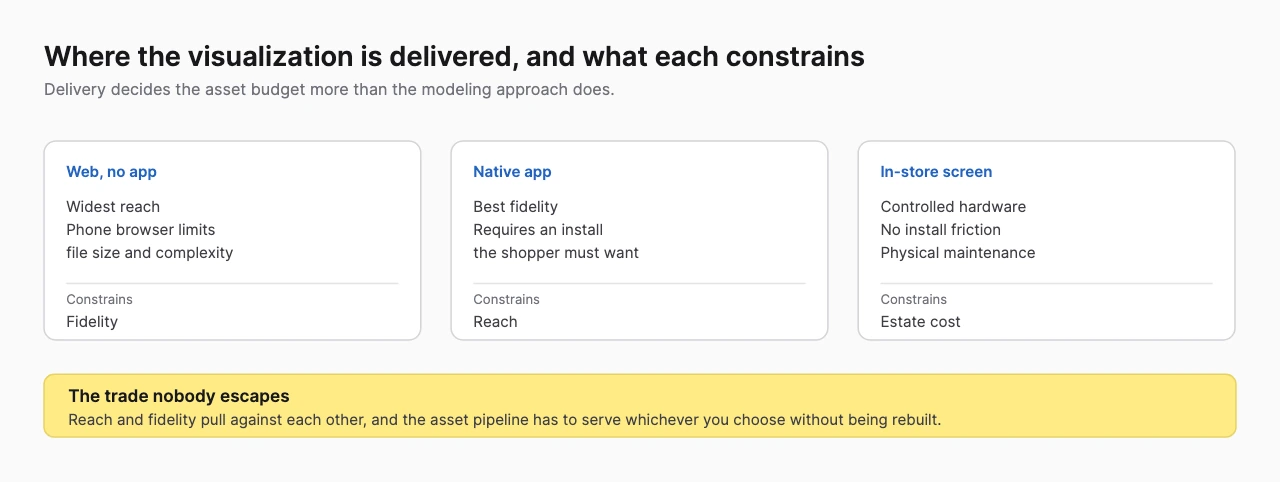
Delivery decides the asset budget more than the modeling approach does, because it sets the ceiling on file size and complexity.
Web delivery without an app has the widest reach and the tightest constraints: a phone browser over a mobile connection limits what can be rendered. A native app removes those limits and adds an install the shopper has to want. An in-store screen has controlled hardware and no install friction, and brings a physical estate to maintain.
The trade nobody escapes is reach against fidelity. What matters is that the asset pipeline serves whichever you choose without being rebuilt, because most programs end up needing more than one.
Product visualization by purchase
Five distinct purchases, each with its own ranked list.
- Best AR companies for product visualization, the cross-segment overview, ranked on asset sourcing and scale
- Best companies for AR product preview and placement, for showing an existing product in a customer's space
- Best companies for AR product visualization in ecommerce, where integration with the commerce stack is the real work
- Best companies for 3D car and automotive configurators, the highest-fidelity end of configuration
- Best companies for custom 3D product configurators, ranked on rules and downstream integration
This category overlaps heavily with the retail guide, which covers the same suppliers from the buyer's side rather than the asset's.
Who supplies product visualization
Three kinds of supplier, and the pipeline question separates them faster than any capability deck.
Asset pipeline platforms industrialise 3D production and delivery. VNTANA and Threekit work this way, optimizing and distributing assets at catalog scale. Their value is throughput, and they are the right answer when the problem is coverage.
Experience studios build individual experiences to a brief. They produce better single results and do not solve coverage, which makes them right for a campaign or a flagship product and wrong for a catalog.
Vertical specialists serve one category deeply. ZeroLight in automotive, Kaon Interactive in complex B2B equipment. They bring domain knowledge that generalists lack, at the cost of flexibility outside it.
Most substantial programs end up needing a pipeline and at least one studio-quality hero experience, and the mistake is buying a studio and expecting it to scale.
What happens after launch
Asset production is not a project that completes. It is an operating cost that continues while you sell things, and the two decay patterns below are what separate programs that last from pilots that were declared successes.
The catalog moves. New ranges arrive, lines are discontinued and specifications change. Every one of those is asset work, and a program budgeted as a project runs out of money at the second range change. The question to settle at purchase is who produces assets for next season, on what cost basis.
The rules drift. For configurators specifically, a rule set encodes what can be made and what it costs, and both change constantly. When the configurator can only be edited by the vendor, it gradually starts offering combinations the business will not honor. That is worse than having no configurator, because the customer has already been told yes.
Both are ownership questions rather than technical ones, and both are cheaper to settle in the contract than to discover in the second year.
What sets the schedule
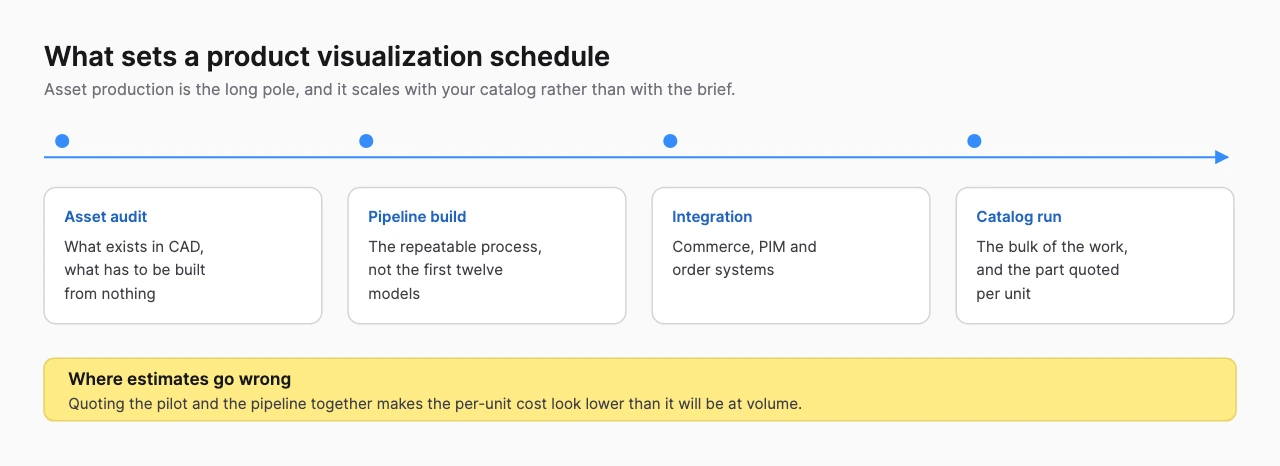
Asset production is the long pole and it scales with your catalog rather than with the brief.
| Cost center | Scales with | Usually quoted | Notes |
|---|---|---|---|
| Asset audit | Catalog size | Rarely | Establishes what already exists in CAD |
| Pipeline build | Product complexity | Sometimes | A one-off cost that makes the rest predictable |
| Per-asset production | SKU count and variants | Yes, at pilot rates | The number that decides the program |
| Integration | Commerce, PIM, order systems | Partly | Depends on systems the supplier does not control |
| Refresh | Range changes per year | Rarely | Never stops while the catalog changes |
Estimates go wrong when the pilot and the pipeline are quoted together, which makes the per-unit cost look lower than it will be at volume. Ask for the two separately.
What you can check, and where
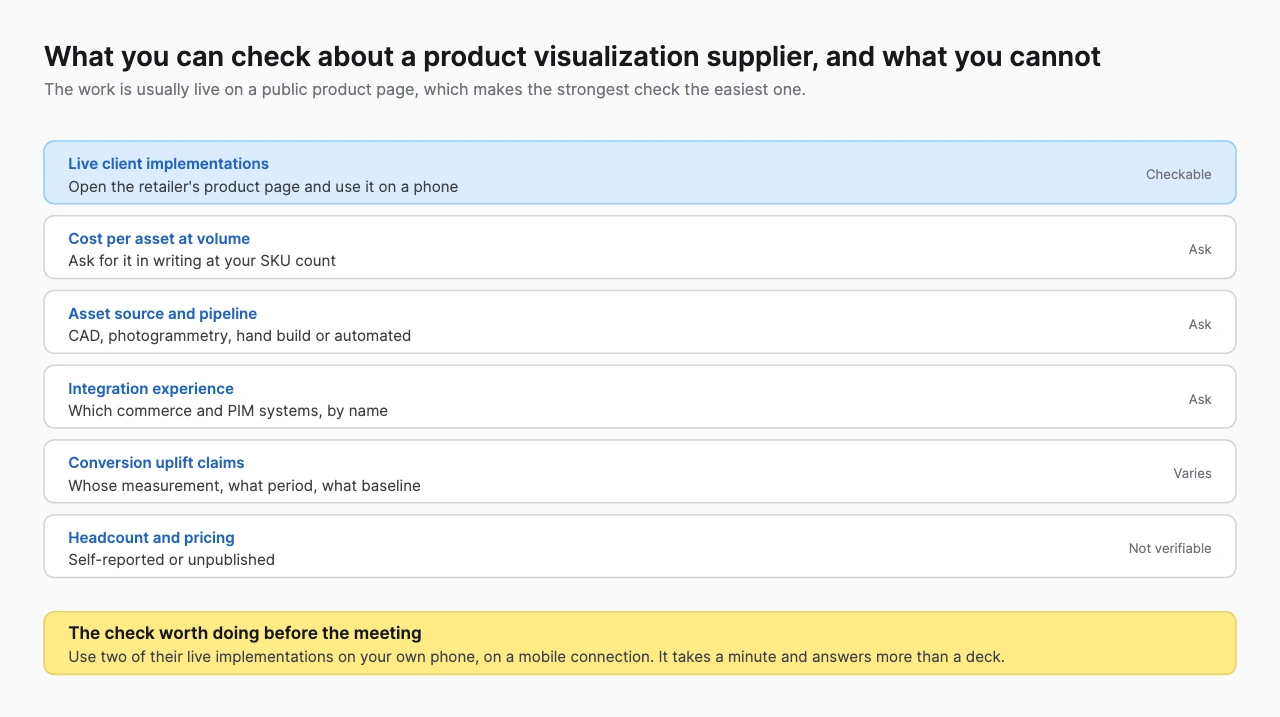
This category has the easiest strong check in the directory: the work is usually live on a public product page. Open two of a supplier's client implementations on your own phone, on a mobile connection, before the meeting. It takes a minute and answers more than a deck.
Conversion uplift claims are the currency here and the least verifiable thing in it. They are almost always the vendor's own measurement of a client pilot, over an unstated period, against an unstated baseline. Where a retailer has published the figure itself it is citable. Where the vendor reports it, it is a claim, and our rankings treat it as such.
Cost per asset at volume is checkable and rarely volunteered. A supplier confident in its pipeline answers in writing. One whose economics work only at pilot scale describes the pilot again.
No primary source exists for market size or adoption projections in 3D commerce, and this site does not repeat them.
How the rankings below were built
Every list linked here ranks on four published criteria and states what is not a ranking factor, set out in each post under How this list was built.
Across these lists the recurring four are where the 3D assets come from, whether asset production scales, where the visualization is delivered and what evidence each publishes. In the configurator lists the criteria shift to how rules are modeled, what the configurator connects to downstream, the rendering approach and what the buyer owns, because that is where those purchases succeed or fail.
The methodology page sets out how entries are assessed.
Where to start
Work out where your 3D will come from, then read the list covering your purchase.
- Top product visualization companies
- Best AR companies for product visualization
- Best companies for AR product preview and placement
- Best companies for AR product visualization in ecommerce
- Best companies for 3D car and automotive configurators
- Best companies for custom 3D product configurators
- Best companies for 3D jewelry and watch configurators
- Best companies for 3D furniture and home goods configurators
- Best companies for interactive 3D parts catalogs
- Best companies for 3D exploded-view visualization
The directory lists developers, platforms and software with sourced entries.
Related reading
Each of these covers one part of this subject in depth, with the suppliers ranked on criteria stated in the post.
- AR Companies for Furniture and Home Goods Placement
- Companies for 3D Product Rendering and Animation
- Companies for VR Virtual Prototyping
- Volumetric Video Companies and Capture Platforms
Frequently Asked Questions (FAQ)
1. What is 3D product visualization?
The use of 3D and augmented reality to show a product before someone owns it, whether placed in their room through a phone, rotated on a product page or configured to a specification that does not yet exist.
2. Which companies build AR product visualization?
They divide by pipeline and delivery. Poplar Studio, Aircards and Zappar work in web AR, VNTANA and Threekit in asset pipelines and configuration, ZeroLight in automotive, and Kaon Interactive in complex B2B products.
3. What decides whether an AR product visualization program scales?
Cost per asset at volume. A pilot of twelve hand-modeled hero products says nothing about a catalog of two thousand SKUs with variants. Ask for the price per model at your real SKU count before committing.
4. What is the difference between a product preview and a configurator?
A preview shows an existing product in a space, using one asset per product and no rules. A configurator computes which combinations are valid, assembles assets from components and must connect to pricing and order systems. The second is a business system with a renderer attached. A third product sits beside both, the interactive parts catalog, which exists to identify an existing component rather than to compose a new one. The exploded view is the technique all three borrow, sold on its own as a rendered animation, as an illustration tied to part numbers or as something the viewer pulls apart.
5. What decides whether a configurator works in production?
Rules and integration, never graphics. It works when the configurator enforces what can actually be made, prices from the same source as the ERP and delivers a specification to the factory rather than a screenshot. A demo with three hand-built variants exercises none of those three.
6. Can you verify AR conversion uplift claims?
Rarely. They are usually the vendor's own measurement of a client pilot, over an unstated period and against an unstated baseline. Where the retailer published the figure, it is checkable. Where the vendor reports it, it is a claim.
7. Should 3D assets come from CAD or photogrammetry?
From CAD wherever it exists, because the data has already been created and the pipeline is a conversion rather than a rebuild. Photogrammetry suits physical goods that were never designed in 3D, and its throughput depends on the capture rig rather than the software.
8. What makes automotive configuration different?
Combinatorics running to millions of valid vehicles, paint that behaves differently under different lighting, buyers who expect photographic fidelity, and an output that must survive a dealer, a finance quote and a factory order without being re-specified.