Digital twin data visualization is the layer that turns a twin's data into something a person can act on, and it is the part most twin programs underfund. This list ranks five on what they actually visualize, whether the visualization is connected to live data or to a model, and who is expected to read it. Rankings draw on each company's own record.
In short:
- Treeview builds custom XR to specification on Unity and Unreal, and transfers full ownership of IP, source code and assets
- TechViz displays directly from CAD, PLM, geospatial and simulation applications without conversion, keeping the visualization tied to live source data
- Dassault Systemes frames a virtual twin as simulating behavior and evolution rather than only mirroring an object, across as-designed, as-made and as-used states
- Toobler publishes digital twin among its capabilities, though its listed case studies are general applications rather than twin projects
How this list was built
This list ranks companies by four criteria: what is being visualized, whether the visualization connects to live data or to a static model, who the intended reader is, and what evidence each publishes.
Visualization is where twin programs are won and lost, and the reason is unglamorous. Most of a twin budget goes into modeling, data plumbing and integration, all of which are invisible. What anyone judges is the screen. A program with excellent data and a poor interface will be described as a failure, and one with mediocre data and a compelling interface will be renewed. That is not an argument for style over substance, it is an argument for funding the interface deliberately rather than treating it as the last two weeks of the project.
The distinction that actually separates suppliers is what sits behind the picture. A visualization can be driven by a model, showing geometry and attributes as they were captured or authored. It can be driven by live data, showing current state from sensors and business systems. Or it can be driven by simulation, showing what would happen under conditions that have not occurred. These require entirely different engineering, and they are frequently conflated in the same proposal.
The second question is who reads it. An engineer wants precision, source traceability and the ability to interrogate. An operator wants current state and exceptions, at a glance, on a screen that is already in front of them. An executive wants a small number of aggregated indicators. A visualization built for one of those audiences and shown to another consistently disappoints, and most twins are shown to all three.
Disclosure varies. Toobler and Digital Twin Studios publish no founding year or team size, and TechViz publishes site header contact details that contradict its own About page. Dassault Systemes is a listed software vendor rather than a development company. Those gaps read Not disclosed rather than as estimates. Pricing is not a ranking factor, because none of the five publishes rates.
| Supplier | HQ | What it is | Visualization driven by | Best for |
|---|---|---|---|---|
| Treeview | Montevideo, Uruguay / New York City, USA | Custom development studio | Whatever the brief specifies | Interfaces built for one audience |
| TechViz | Paris, France | Visualization software editor | Live CAD, PLM and simulation data | Engineers who need source fidelity |
| Dassault Systemes | France | Listed software vendor | Simulation across the lifecycle | Behavior and prediction, not just state |
| Toobler | Not disclosed | Engineering services company | IoT and OT to IT integration | Connecting data before showing it |
| Digital Twin Studios | Not disclosed | XR design and development studio | Immersive learning content | Education and training audiences |
1. Treeview
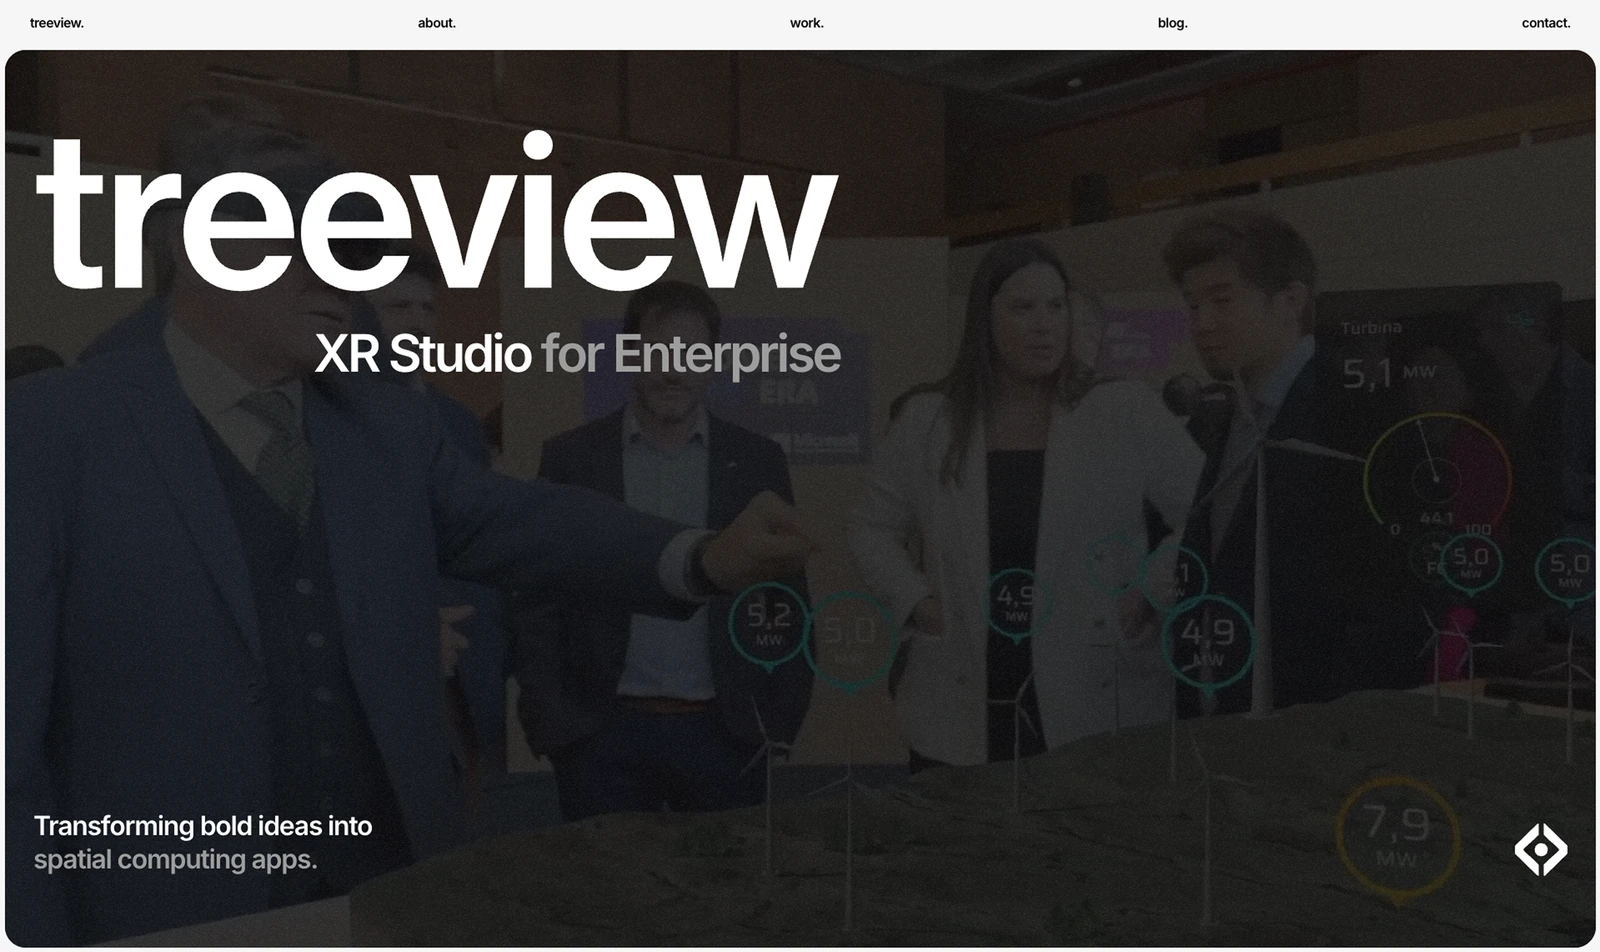
Treeview is an XR studio building custom virtual reality, augmented reality, Mixed Reality and Smart Glasses applications to order, and on a visualization list its relevance is that visualization is precisely the layer a custom studio is for.
The reasoning is straightforward. The parts of a twin that are the same for everyone, ingestion, storage, historization, query, are well served by platforms and should usually be bought. The part that differs for every organization is what a specific person needs to see in order to make a specific decision. That is a design problem before it is an engineering one, and it does not come out of a box.
Its published twin work is an AI-enabled digital twin designed and developed with Microsoft for a multi-billion dollar green hydrogen renewable energy project, combining accurate plant geometry, live operational data and a real-time environment. Building on top of a platform rather than replacing it is the pattern this category usually wants, and it is worth asking any custom supplier whether they intend to do that or to rebuild the plumbing.
Its device coverage is the widest published here and matters for visualization specifically, since where a visualization is read determines what it can be. HoloLens 2, Apple Vision Pro and Meta Quest support in-place viewing where an engineer stands at the asset. iOS and Android reach people who will never wear a headset, which in practice is most of an organization. Development is on Unity and Unreal Engine.
Full ownership of IP, source code and assets transfers to the client, which matters because visualizations are revised more often than the twins beneath them. Every new audience wants a different view, and if each is a change request against a supplier who owns the code, the interface stops evolving. Founded in 2016 by chief executive Horacio Torrendell, it works from Montevideo, Uruguay and New York City. Team size, rates and named twin platform integrations are not published. Best for interfaces designed for one audience and one decision, that you intend to keep changing.
2. TechViz
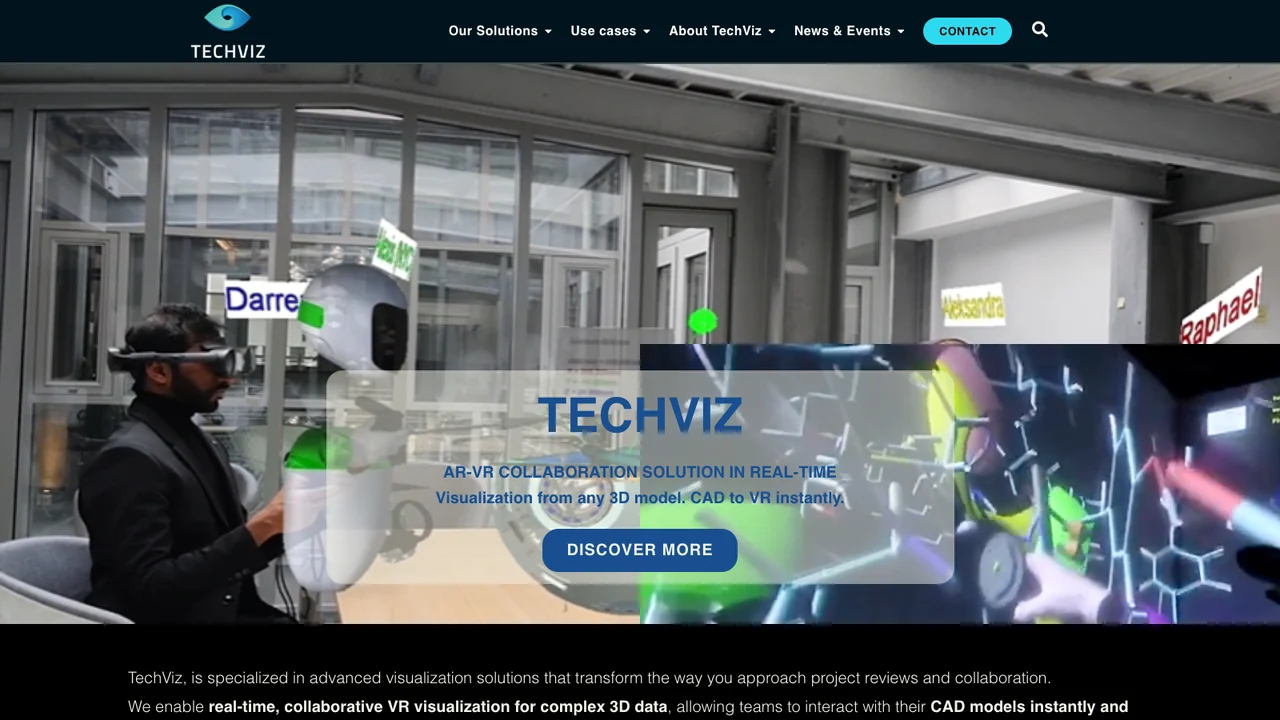
TechViz is a software editor founded in 2004 and headquartered in Paris, with offices in Chicago, Beijing and Bangalore, providing advanced visualization for 3D applications. Its defining technical claim is that it displays virtual prototypes directly from desktop 3D CAD, PLM, geospatial and simulation applications into a virtual environment, without conversion and in real time.
For a data visualization list, that no-conversion approach is the most interesting position here, and it solves a problem the rest of this market lives with. Conventional twin visualization exports geometry, optimizes it, and displays the result, which means what a person sees is a copy that was correct at export time. TechViz displays the live application, so the visualization cannot drift from the source and no geometry has been simplified away. For an engineer making a judgement about a tolerance or a clearance, that difference is the whole point.
Its compatible applications are CAD systems including CATIA, Creo, NX and SolidWorks, which is where engineering source data actually lives. Its published product offer is TechViz XL, Share&Viz and Cloud&Viz, and its features list includes virtual assembly, virtual reviews, human factors, human body tracking, finger tracking, automated reporting, video recording and a TVZLib API. Human factors and body tracking point at ergonomic assessment, which is visualization used to answer a question rather than to present a state.
Its stated use cases are digital mock-up, ergonomics, immersive design reviews, operability, maintainability and manufacturability, and training, across aeronautics and aerospace, automotive, military and defense, energy oil and gas, shipbuilding, architecture and construction, pharmaceutical and transportation.
The limit is what it visualizes. This is engineering geometry, not live operational sensor data, so an operator wanting current plant state is looking at the wrong product. One disclosure note: its site header publishes a phone number, email and address that appear to be unfilled template placeholders and contradict its own About page, which states the Paris headquarters. Best for engineering review where fidelity to source data is the requirement.
3. Dassault Systemes
Dassault Systemes is a listed software vendor rather than a development company, and it publishes the most developed conceptual position in this list. Its stated distinction is that a virtual twin goes beyond a digital twin by not only mirroring physical objects but also simulating their behavior and evolution in real time.
That is a substantive claim rather than marketing framing, and it changes what visualization means. A twin that mirrors state can show what is happening. A twin that simulates behavior can show what would happen, which is a different and considerably more valuable thing to put in front of someone making a decision. Its published description covers the full lifecycle, starting from a 3D model capturing shape, dimensions and properties, running simulations to optimize design, materials and processes while documenting decisions for traceability.
The as-designed, as-made and as-used framing is the most useful idea to take from this entry regardless of what you buy. Most twin programs conflate those three states and then discover the model does not match the built asset. Naming them separately, and being explicit about which one a given visualization represents, prevents an entire class of misunderstanding.
It also publishes system-level simulation, describing virtual twins interacting with one another, using the example of a shampoo bottle's journey through production, packaging, shipment and use. Its platform is 3DEXPERIENCE, its industries span Manufacturing, Life Sciences and Healthcare, and Infrastructure and Cities, and it publishes quarterly financial results as a listed company, so its finances can be read before a long commitment.
The caveats are those of any large platform vendor. This is a broad portfolio rather than a visualization product, so scoping which parts apply is part of the engagement, implementation is typically through partners rather than the vendor, and commitment is to an ecosystem. It publishes no rates for this. Best for organizations that need simulation and prediction rather than a view of current state.
4. Toobler
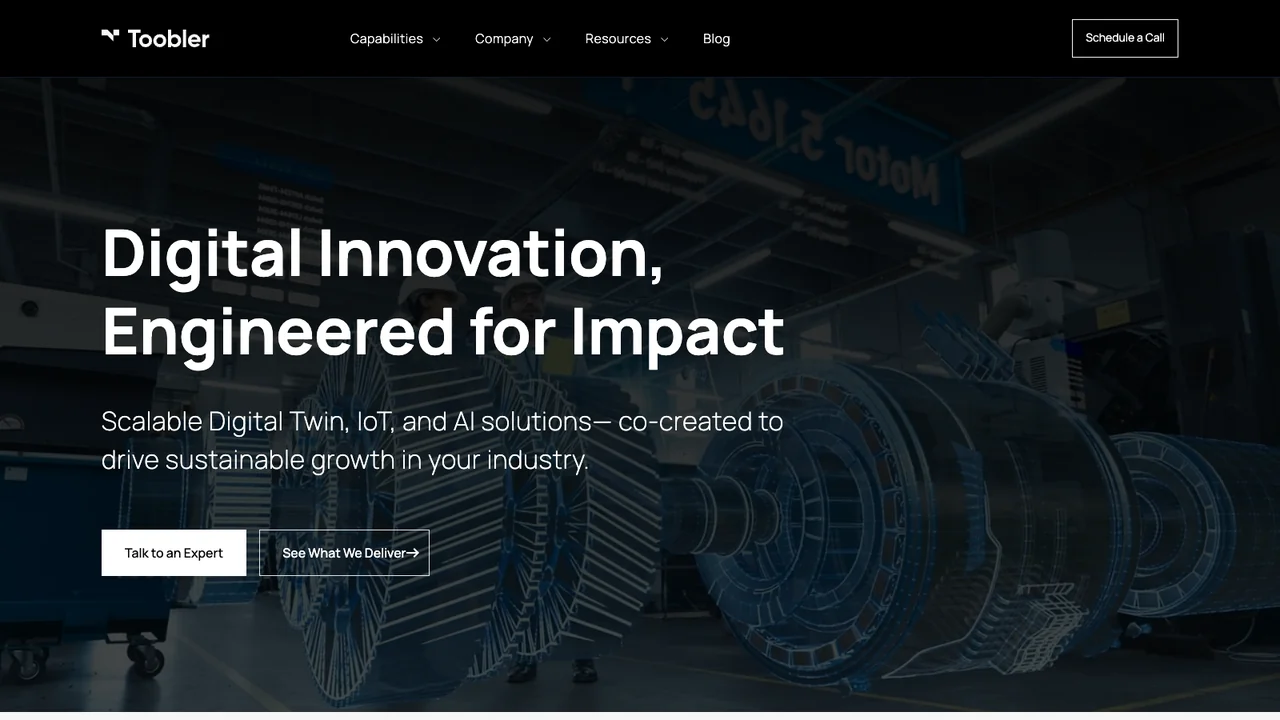
Toobler is an engineering services company, published as Toobler Technologies, and its listed capabilities are Digital Twin, Industrial AI, IoT Engineering, Data and Integrations covering OT to IT, Visualization spanning 2D, 3D, IFC and Unity, Workflow Orchestration, App Development, Cloud and Kubernetes, DevOps and SRE, and Security and Compliance.
The capability worth noticing is Data and Integrations, described as OT to IT. That is the unglamorous problem sitting underneath every twin visualization, and it is where most programs actually stall. Operational technology systems, the controllers and historians that hold real plant data, were not designed to be queried by modern applications, and getting data out of them safely is specialist work that visualization vendors tend to assume someone else has done.
Its published visualization line covering 2D, 3D, IFC and Unity is unusually specific in a useful way. IFC indicates building and construction data, and Unity indicates real-time and XR output, so it is claiming a route from operational data through to a real-time interface rather than only dashboards.
The significant caveat is evidence, and it should be weighed carefully. Its published case studies are an Enterprise Web Platform, a Hospitality App, an online e-commerce store, an Asset Tracker App, a Data Management App, a Survey App, a Replenishment Solution and a Regatta Management App. Those are general software projects, and none is presented as a digital twin. A buyer evaluating it for twin visualization is therefore assessing stated capability rather than demonstrated twin work, and should ask directly for twin references with named clients and outcomes.
It publishes no founding year, headquarters address, team size, named twin clients or rates on the pages reviewed. It ranks fourth on the relevance of its integration capability set against the absence of published twin evidence. Best for organizations whose blocker is getting operational data out of OT systems in the first place.
5. Digital Twin Studios
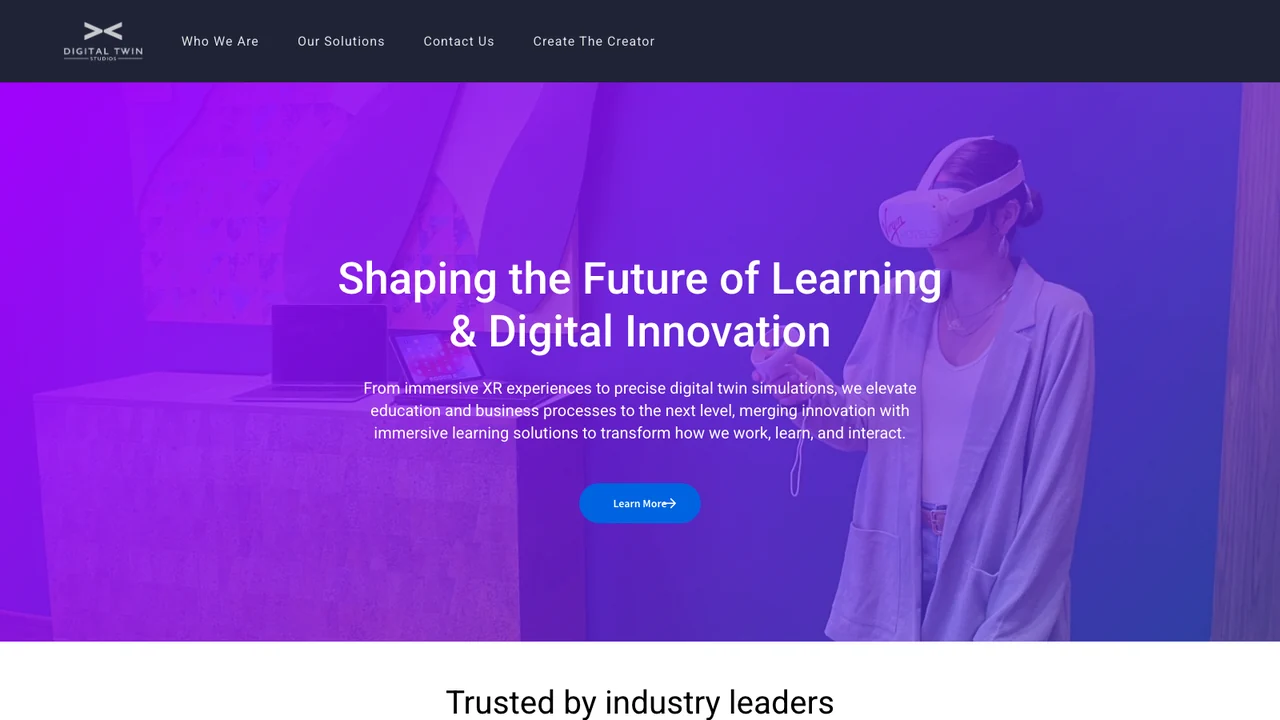
Digital Twin Studios requires a category note, because its name and its published positioning point in different directions. It describes itself as an award-winning XR design and development studio, and its stated purpose is transforming business and education through tailored immersive learning solutions for global companies and educational institutions.
Its published services are XR Design and Development and Learning Development, and it describes merging technology and creativity to create immersive metaverse and digital twin solutions, with a strong focus on educational growth and immersive learning. Digital twin appears in its language, but the center of gravity in what it publishes is immersive learning rather than operational data visualization.
That does not make it irrelevant, and there is a genuine use for it. One legitimate audience for twin visualization is people learning a facility rather than operating it: new starters, contractors, students on an engineering course, apprentices who need to understand a plant before they set foot in one. A studio whose discipline is instructional design is better equipped for that audience than a data platform, because the requirement is comprehension rather than precision.
What a buyer should not expect is live operational data visualization. Nothing published on the pages reviewed describes sensor integration, historians, OT connectivity, query interfaces or real-time state. Its stated strength is producing immersive content that teaches, and evaluating it against that is fair while evaluating it as an operational twin vendor is not.
It publishes no founding year, headquarters address, team size, named clients or rates on the pages reviewed, and states that it is trusted by industry leaders without naming them, so references need requesting directly. It ranks fifth on a data visualization list because its published work is learning rather than data. Best for training and education audiences who need to understand a facility.
What twin visualization projects have to account for
Four things determine whether anyone opens the visualization a second time.
The first is naming the reader and the decision. Write down who opens this, how often, and what they do differently as a result. A visualization serving engineers, operators and executives simultaneously usually serves none of them, and the failure shows up as low usage rather than complaints. Three focused views beat one that tries to satisfy everyone.
The second is establishing what drives the picture. Model, live data or simulation are different products with different costs, and proposals frequently blur them. Ask specifically what is live, at what refresh rate, and what is a snapshot. Users assume everything they see is current unless told otherwise, and that assumption causes real errors.
The third is the data path before the picture. Getting data out of operational technology systems safely is usually the hardest and least visible part, and it is often assumed rather than scoped. If nobody in the proposal owns OT connectivity, the visualization will be demonstrated on sample data and then wait. Toobler's OT to IT capability is aimed at exactly this.
The fourth is where it is read. A visualization only usable in a headset reaches whoever has a headset, which is few people. Mobile and desktop delivery reach everyone else. Treeview publishes iOS and Android alongside headsets, and TechViz publishes desktop and cloud options. Decide the delivery surface from the audience rather than from the technology.
How to choose between these twin visualization companies
Start from what the picture has to be true to. If it must match engineering source data exactly, TechViz's no-conversion approach is the most direct answer and nothing else here matches it. If it must show behavior under conditions that have not occurred, that is simulation and Dassault Systemes is the entry built around it. If it must show current state, the hard part is the data path and Toobler's OT to IT work is aimed there. If it must teach someone the facility, Digital Twin Studios is an instructional design supplier. If it must be exactly what one audience needs and nobody sells that, Treeview builds it and hands over the source.
Then weigh published evidence against stated capability, because they differ sharply in this list. TechViz publishes a product line with a documented technical approach. Dassault publishes a developed conceptual model and audited accounts. Toobler publishes twin capability with no twin case studies. Digital Twin Studios publishes learning work under a twin name. Ask each for one named reference doing what you need.
Fund the interface as its own line. Visualization treated as the final phase of a twin project receives whatever budget and time remain, which is why so many twins are judged harshly on the only part anyone sees.
Finally, watch someone use it before you accept it. Not a demonstration by the supplier, but your own engineer or operator, on your own data, finding something they actually needed to know. That single test predicts adoption better than any feature list.
Related reading. BestInXR's digital twins guide covers what separates a twin from a model or a shadow. companies for custom digital twin development covers what sits behind the interface, and companies building digital twins on Unity and Unreal covers the real-time engine route. For construction see companies for BIM and construction digital twins, and for the energy sector, digital twin platforms and development companies for energy.
Frequently Asked Questions (FAQ)
1. What is actually being visualized in a digital twin?
One of three things, and they are frequently conflated. A model shows geometry and attributes as authored or captured. Live data shows current state from sensors and business systems. Simulation shows what would happen under conditions that have not occurred. Each needs different engineering, so establish which a proposal is offering.
2. Why does conversion matter for visualization fidelity?
Because most visualization exports geometry and optimizes it, so what a person sees is a simplified copy that was accurate at export time. TechViz states that it displays directly from CAD, PLM, geospatial and simulation applications without conversion, so the view cannot drift from source. For dimensional judgements that distinction is the whole point.
3. Which of these publish twin case studies?
Treeview publishes an AI-enabled twin developed with Microsoft for a green hydrogen project. Dassault Systemes publishes its virtual twin framework across manufacturing, life sciences and infrastructure. TechViz publishes use cases in digital mock-up and design review. Toobler's published case studies are general applications rather than twins, and Digital Twin Studios publishes immersive learning work.
4. Does the visualization need to be in a headset?
Only where being at the asset matters, such as in-place inspection or ergonomic assessment. Headsets reach only the people issued one, which is a small fraction of most organizations. Treeview publishes iOS and Android alongside headsets, and TechViz publishes desktop and cloud delivery. Choose the surface from the audience rather than the technology.
5. What is the OT to IT problem?
Operational technology systems such as controllers and historians hold real plant data but were not designed to be queried by modern applications, and extracting from them safely is specialist work. Toobler publishes this as a named capability. Where no one in a proposal owns it, the visualization tends to be demonstrated on sample data and then stall.
6. What does twin visualization cost?
None of the five publishes rates, so no figure is recorded here. Cost is driven by how many distinct audiences need views, whether data is live or static, how much OT integration is required, and the delivery surfaces supported. Revising views as new audiences appear is the line most often missing from a first budget.